Smart Apps
Codified apps with guided workflow to address the business problems in process industry enable speed of development, scale of deployment, and adoption through our deep experience to add value on top of your existing solutions.
- Oil &
Gas - Life Sciences/
Pharma - Metals, Mining &
Cement - Chemicals &
Petrochemicals - Power &
Renewables - Food, Beverages, CPG and Other Manufacturing
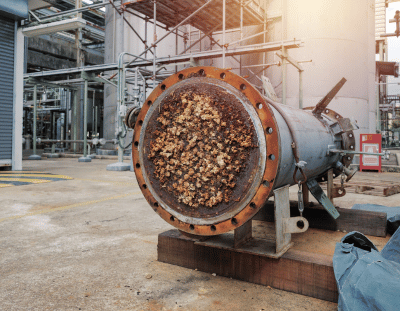
Heat exchangers performance monitoring
Predicting the end-of-cycle (EOC) for a heat exchanger due to fouling is a persistent challenge for refineries. By proactively forecasting when a heat exchanger requires cleaning, refineries can implement risk-based maintenance planning, optimizing processing rates, and reducing operating and maintenance costs. Historically, engineers had to manually combine data entries in spreadsheets, spending hours or even days formatting, filtering, and removing non-relevant data, such as entries when equipment was out-of-service. Advanced analytics now streamline this process, enhancing efficiency and accuracy in maintenance planning.


- Fluid with dissolved impurities upon reaching saturation deposit on the inner tubes causing scaling
- Scaling also provides sites for corrosion and improper heat transfer

- Using ML to create a PdM model to allow personnel to take necessary action before failure
- Parameter creation of Overall Heat transfer Coefficient(U) that varies with time
- Employing physics-based features to predict fouling

- Reduction in unplanned downtimes by >50%
- Savings of around $1M
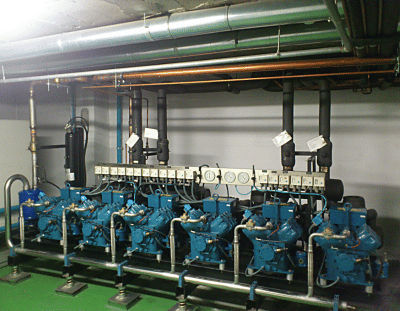
Performance optimization in process compressors
Unplanned downtimes lead to reactive and time-based maintenance which can be costly and inefficient. Difficult to quantify metrics that correlate with the overall performance and health of the compressor.


- Unplanned downtimes lead to reactive and time-based maintenance which can be costly and inefficient
- Difficult to quantify metrics that correlate to valve health

- Use first principles to predict the efficiency and power in real-time
- Develop ML model to predict the anomalies in real-time leading to sub-optimal operations

- Email notifications for real-time deviations
- Recommendations to close the loop for optimal operations
- 2-5 % reduction in energy consumption
- 45-50 % Reduction in unplanned downtimes
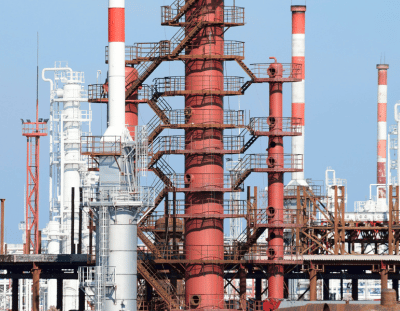
Distillation Column Efficiency
Effective monitoring of a debutanizer column is essential for maximizing the LPG content in the top product and optimizing overall distillation performance. Continuous monitoring of the C4 fraction in the bottom products ensures process efficiency and quality control. Implementing a predictive model to estimate the butane fraction in the bottoms enhances performance by allowing for real-time adjustments and proactive decision-making. This approach not only improves the yield and purity of the top product but also ensures the stability and efficiency of the distillation process.


- Changes in feed quality impact the efficiency of columns
- Frequent vacuum pumps/ reboilers and condenser failure causes operational upsets

- ML-algorithm based PdM model for vacuum pump and reboiler
- Employing Data Analysis to understand trends and create indicators to drive predictions
- Employing first-principle based equations to understand status of machine

- 23% decrease in downtime
- Increase in efficiency by 8-10%
- ~ 250k Savings annually

Furnace efficiency prediction
Predicting furnace efficiency in the oil and gas industry involves the use of sophisticated modeling techniques and real-time data analytics to forecast and optimize the performance of furnaces used in refining and processing operations. The goal is to achieve maximum energy efficiency, reduce fuel consumption, and minimize emissions while ensuring optimal processing conditions.


- Ethylene furnaces coke (foul) during cracking operations resulting in a loss of efficiency
- Improper decoking can result in equipment damage and lost production time

- Identify different phases of decoke operation and excessive hold times
- Predict decoke effectiveness with KPIs like temperature recovery and run time between decokes

- Tracking decoke effectiveness metrics identified procedural inefficiencies and inconsistency in execution.
- Optimization of decoke procedures reducing hold time and dead time has resulted in an additional $250k/y in production.

Virtual Metering for production estimation
Virtual metering for oil rate prediction in the oil and gas industry is a technology-driven approach that uses mathematical models and algorithms to estimate the production rate of oil wells in real-time without the need for physical flow meters. This method offers a cost-effective, accurate alternative to traditional measurement techniques, especially in environments where installing physical meters is impractical or too expensive.


- Production allocation metering, of necessity, is usually less accurate, frequently much less accurate.
- Further, it is frequently difficult to estimate accurate allocation metering

- Use historical production data to predict the production rates in real-time for oil and gas
- Using hybrid modeling approach (1st principle and data driven) models integrate the reservoir conditions with the production rates

- Real time estimation of the production rates – oil, gas and water
- > $M savings annually
- Increase in productivity of wells by ~ 2-3%
%E2%80%8B.png?width=400&height=311&name=Cycle%20Time%20Optimization%20(CTO)%E2%80%8B.png)
Cycle Time Optimization (CTO)
Reducing cycle time in batch manufacturing is challenging due to the complexity of defining and analyzing process phases to identify variations and idle times between batches. Additionally, pinpointing areas for process and capital improvements requires detailed understanding and analysis. Effective batch tracking and cycle time analysis are essential to uncover inefficiencies, minimize idle times, and make informed improvement decisions.
%E2%80%8B.png?width=400&height=311&name=Cycle%20Time%20Optimization%20(CTO)%E2%80%8B.png)

- It is difficult to define and analyze historical batches with traditional analytics tools.
- To track various activities of a batch is challenging due to complex dynamics of the process

- Dynamic dashboards view to monitor your batches
- Track deviating batches in near real time
- Identify the opportunities for continuous improvement-cycle time optimization

- Eliminate idle time within batches and time between batches
- Reduced process variability by approx~ 12 to 16%
- Average savings $20,000 to $50,000 per batch
.png?width=400&height=311&name=Batch%20alarm%20analysis%20and%20interpretation%20(2).png)
Batch alarm analysis and interpretation
Batch alarm analysis and interpretation involves the systematic review and evaluation of alarm logs generated during batch processes in industrial settings. This process is crucial for identifying, categorizing, and analyzing patterns of alarms that may indicate operational inefficiencies, safety issues, or equipment malfunctions. By employing statistical and AI techniques, analysts can prioritize alarms based on their frequency, urgency, and potential impact. This allows operators to implement more effective responses and preventive measures, optimizing process safety and efficiency. The ultimate goal is to minimize false alarms and enhance the reliability and safety of industrial operations.
.png?width=400&height=311&name=Batch%20alarm%20analysis%20and%20interpretation%20(2).png)

- Difficult to estimate and prioritize the critical alarms in real time
- Interpretation of process degradation and frequency of alarms is often challenging due to non-linearity of process

- Real time dashboards to enable
- Identify and categorise false positives
- Track complex multivariate /pattern-based alerts
- Estimate the potential of –Severity, frequency

- Improvement in productivity by 35-40%
-
Reduction in critical alarms by 6-8%

Batch Yield Optimization
Batch quality prediction is crucial for optimizing manufacturing processes and ensuring efficient resource utilization. By accurately predicting batch quality, manufacturers can adjust process inputs in real-time, improving yield and reducing waste. This proactive approach helps minimize energy consumption and raw material usage, leading to more efficient and cost-effective production.


- Difficult to maintain consistent yield across all the batches
- Difficult to estimate the CPPs across multiple batches

- Multivariate analysis for estimation of the critical process parameters
- Smart optimizers based on non-linear models to predict the set points for the MVs for maximizing the yield in real time

- Eliminate idle time within batches and time between batches
- Reduced process variability by approx~ 12 to 16%
- Average savings $20,000 to $50,000 per batch

Predictive Maintenance Of Lyophilizers
Predictive maintenance for a lyophilizer, also known as a freeze-dryer, focuses on the proactive identification and mitigation of potential equipment failures before they occur. This approach utilizes various data-driven techniques and monitoring tools to track the condition of the lyophilizer’s critical components such as vacuum pumps, condensers, and temperature sensors.


- Traditional preventive maintenance schedules are based on time or run hours, which can lead to unnecessary downtime and maintenance costs.
- Difficult to predict the maintenance requirements due to process varabilities

- Batch unfolding technique to label and rate the batches health in real time
- Predict the health score in real time

- Reduced downtime by 25-30%
- Move beyond calendar based preventive maintenance
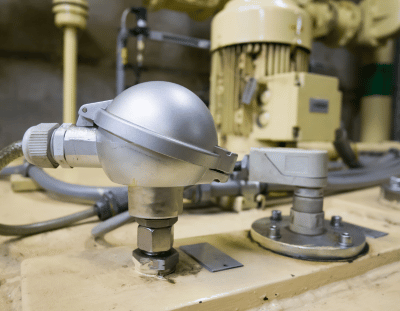
Soft-sensor for yield prediction
Soft sensors, or virtual sensors, in the pharmaceutical industry are predictive models that estimate process outputs or product qualities using available process data. These are particularly useful for yield prediction, where direct measurement is challenging, expensive, or invasive. Soft sensors leverage real-time data along with machine learning or statistical models to predict yields, thereby enhancing process control, efficiency, and quality assurance.


- Delayed lab results make it difficult to optimize inputs of the process to control the batch yield
- Process inputs are set with a known value which can lead to wasted energy and raw materials

- Create an on-line model for the yield based upon the concentration, volume, and temperature; in near real-time

- Rapid identification and root cause analyses of abnormal batches saving millions of dollars
- Reduce wasted energy and materials
- Reduce out-of-specification batches by adjusting process parameters during the batch
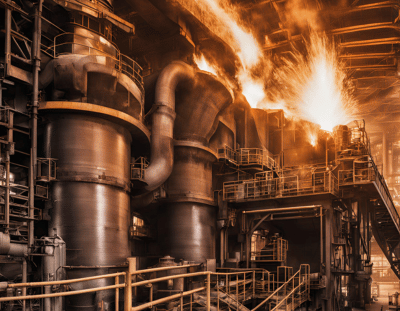
Productivity improvement blast furnace operations
Operating under intricate and dynamic conditions, blast furnaces are susceptible to hanging events influenced by numerous parameters. However, the interior of a blast furnace is inaccessible and challenging to monitor directly, hindering the real-time detection of hanging incidents. This project focuses on developing predictive models to anticipate hanging events in blast furnaces. By leveraging advanced analytics and historical data, operators can forecast the likelihood of hanging incidents, enabling proactive interventions to mitigate risks and optimize furnace performance. Enhancing operational safety and efficiency, this initiative aims to safeguard personnel and equipment while maximizing production continuity in blast furnace operations.


- Complex and dynamic conditions with various parameters makes it difficult to detect hanging incidents in real-time
- Silicon content of the molten iron is an important indicator of the furnace temperature variations

- ML based models to predict the deviations in the furnace operations – correlated with hanging
- Predict silicon content in real time using the historical data

- 2-3% Increase in blast furnace productivity
- ~ 450-600k Savings annually
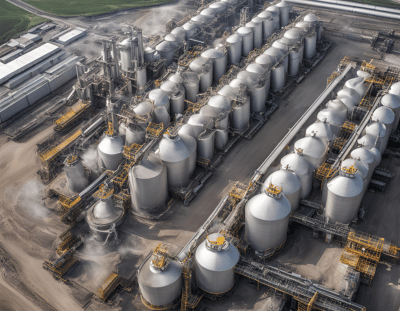
Feed strategy optimization in aluminum smelters
Maintaining precise bath temperature (958±2°C) is crucial for efficient aluminum production. However, existing controllers often struggle to regulate temperature, causing fluctuations in both temperature and ALF3 mass. This use case explores developing an optimized ALF3 feed strategy to address these challenges. By leveraging advanced control algorithms, we aim to minimize fluctuations and enhance overall production efficiency. Download the PDF for details on this optimization approach.


- Difficult to maintain the bath temperature and excess ALF3 in the specified range
- Experience based ALF3 addition directly impact the performance of the smelters productivity

- Adv. Conditioning for identifying the deviations in the bath temperature and excess ALF3
- Using historical data to model the required ALF3 feed to be added for optimal operations

- 6-10% decrease in unplanned downtime
- Informed decision making
- Reduction in process variability by 35-40%

Real-Time Deployment of BTP Prediction Model in Sinter Plant
Ensuring the quality and productivity of sinter production in the iron industry relies heavily on monitoring and maintaining the Burn-Through Temperature (BTP) position and temperature. However, critical data such as %coke, coke fines, and sinter bed were previously unavailable, posing challenges to effective monitoring and prediction. This initiative focuses on deploying a real-time BTP prediction model in the sinter plant, leveraging advanced analytics and data integration techniques to overcome data limitations. By harnessing real-time data and predictive modeling, operators can optimize BTP monitoring, enhance process control, and improve overall sinter quality and productivity.


- In the Iron industry, it is critical to monitor and maintain the Burn-Through Temperature (BTP) position and temperature to ensure quality and productivity
- The critical data such as %coke, coke fines, sinter bed were not available

- To maximize BTP temperature at Windbox 11 position by combining 1st principle & ML
- What-if analysis tool was developed
- Optimizer was used to optimize the process parameters

- Increase in sinter productivity ~ 5%
- Informed decision making
- Reduction in process variability by 20-25%
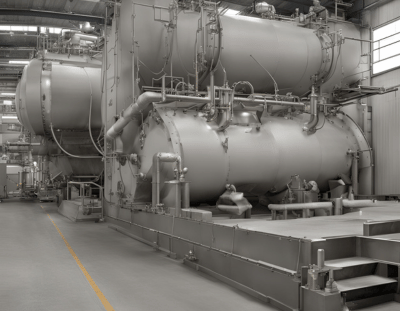
% Silica prediction in froth floatation process
In the realm of mining operations, predicting the final quality of iron concentrate is pivotal for optimizing production processes. This project focuses on forecasting the percentage of silica present in the iron ore concentrate, a key determinant of its quality. By leveraging real-time data and predictive modeling techniques, engineers can anticipate silica levels in the concentrate, enabling proactive decision-making and process improvements. With impurity measurements taken hourly, accurate predictions empower engineers with early insights, facilitating timely actions to enhance operational efficiency and product quality in iron ore mining operations.


- Estimation of % silica in the ore is challenging to ensure the separation
- Higher silica content directly influences the production cost for steel manufacturing.

- Real time prediction of % silica in the output enables to take the corrective actions
- Early event indicators helps the operators to plan the operational strategy with appropriate set point changes

- Optimized energy consumption ~ 4-6%
- Reduced process variability by ~ 12-16%

Boiler efficiency prediction
Soft sensors, or virtual sensors, in the pharmaceutical industry are predictive models that estimate process outputs or product qualities using available process data. These are particularly useful for yield prediction, where direct measurement is challenging, expensive, or invasive. Soft sensors leverage real-time data along with machine learning or statistical models to predict yields, thereby enhancing process control, efficiency, and quality assurance.


- High variations in fuel quality and feed leads to operational challenges in maximizing the steam generation
- Degradation of boiler efficiency leading to suboptimal combustion strategies

- Enthalpy balance in boilers for incoming streams and generated steam to track the efficiency in real-time
- Predicting the efficiency degradation and recommending the corrections to counter impact the fuel quality variations

- Optimal Steam to fuel ratio
- 4-7 % energy savings/ year
- Reduction in greenhouse gas emissions of 200 tonnes of CO2 per year
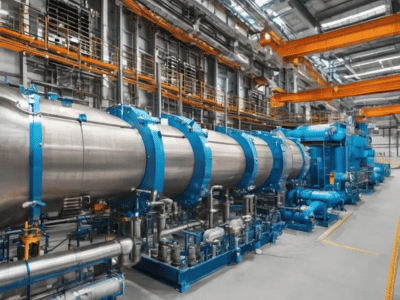
Heat exchangers performance monitoring
Predicting the end-of-cycle (EOC) for a heat exchanger due to fouling is a persistent challenge for refineries. By proactively forecasting when a heat exchanger requires cleaning, refineries can implement risk-based maintenance planning, optimizing processing rates, and reducing operating and maintenance costs. Historically, engineers had to manually combine data entries in spreadsheets, spending hours or even days formatting, filtering, and removing non-relevant data, such as entries when equipment was out-of-service. Advanced analytics now streamline this process, enhancing efficiency and accuracy in maintenance planning.
.webp?width=1024&height=1024&name=Heat%20exchangers%20performance%20monitoring%20(1).webp)

- Fluid with dissolved impurities upon reaching saturation deposit on the inner tubes causing scaling
- Scaling also provides sites for corrosion and improper heat transfer

- Using ML to create a PdM model to allow personnel to take necessary action before failure
- Parameter creation of Overall Heat transfer Coefficient(U) that varies with time
- Employing physics-based features to predict fouling

- Reduction in unplanned downtimes by >50%
- Savings of around $1M
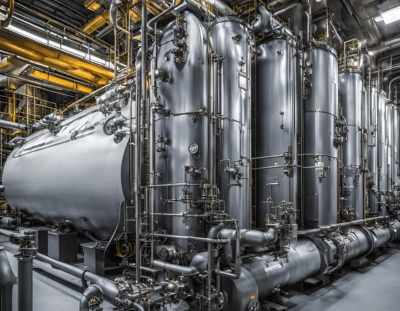
CO and Nox Prediction for Boiler – Energy Sustainability
Effective prediction of NOx and CO emissions from boilers is crucial for regulatory compliance and environmental protection. Key process parameters (KPIs) correlated with emission levels include combustion temperature, fuel composition, air-to-fuel ratio, and flue gas recirculation rates. By analyzing both historic and real-time data, it is possible to predict NOx and CO emissions accurately. This predictive capability allows for better operational adjustments, ensuring emissions remain within permissible limits while optimizing boiler performance. Advanced analytics and machine learning techniques enhance the precision of these predictions, contributing to more efficient and environmentally friendly boiler operations.


- The challenge lies in optimizing the combustion process in boilers to reduce both nitrogen oxide (NOx) emissions and carbon monoxide (CO) levels.
- This requires addressing the poorly designed combustion air systems that lead to excessive air intake, inefficient mixing, and subsequent emissions.

- Identify the important Process Parameters (KPI’s) that are correlated with the Emission parameters
- Prediction of Nox and CO based on historic and real time data

-
Fuel savings ranging from 2% to 5% annually
-
~ $2.7 million annual benefit
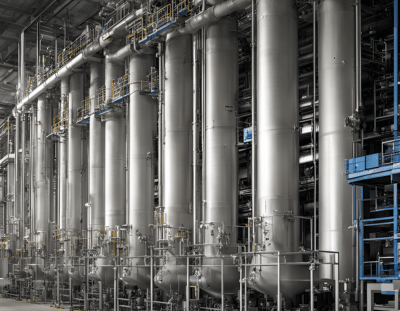
Debutanizer Column Monitoring
Effective monitoring of a debutanizer column is essential for maximizing the LPG content in the top product and optimizing overall distillation performance. Continuous monitoring of the C4 fraction in the bottom products ensures process efficiency and quality control. Implementing a predictive model to estimate the butane fraction in the bottoms enhances performance by allowing for real-time adjustments and proactive decision-making. This approach not only improves the yield and purity of the top product but also ensures the stability and efficiency of the distillation process.


- Gas Chromatograph is used to continuously monitor the C4 content in the bottoms.
- Higher content of C4-frac in bottoms can lead to a lower quality of LPG product.
- Gas chromatograph is often off due to maintenance, due to which the challenges in monitoring the product quality arises.

- Predictive model for estimating the Butane fraction in the bottoms, for better performance
- Continuous monitoring of C4 fraction in the bottom products
- Maximizing the LPG content in the top product

- 23% decrease in downtime
- Increase in efficiency by 8-10%
- ~ 250k Savings annually

Performance optimization in process compressors
Unplanned downtimes lead to reactive and time-based maintenance which can be costly and inefficient. Difficult to quantify metrics that correlate with the overall performance and health of the compressor.

- Unplanned downtimes lead to reactive and time-based maintenance which can be costly and inefficient
- Difficult to quantify metrics that correlate to valve health
- Use first principles to predict the efficiency and power in real-time
- Develop ML model to predict the anomalies in real-time leading to sub-optimal operations
- Email notifications for real-time deviations
- Recommendations to close the loop for optimal operations
- 2-5 % reduction in energy consumption
- 45-50 % Reduction in unplanned downtimes

Cooling Tower Health Monitoring
Unlocking efficiency in cooling tower operations entails understanding the interplay between temperature signals and equipment power. This analysis delves into identifying which temperature signals significantly impact power consumption, paving the way for predictive modeling to optimize compressor power.


- Impact of seasonality and load requirements are unknown
- More than required energy consumption in fan, water losses

- Predict the energy requirements using adv modeling to regulate the fan RPM
- Monitor and track the losses – evaporative, drift and blowdown of the water stream

- Timely and effective maintenance for cooling towers.
- Increased efficiency by 12-16%

Induced Draft Fan Predictive Maintenance
Predictive maintenance for ID fans prevents costly downtime by detecting potential failures early. Traditional checkups may overlook issues or be costly and unnecessary. Visualizing vibration trends is difficult due to dust build-up. By using predictive techniques, organizations can minimize downtime and maintenance costs, ensuring continuous fan operation and profitability.


To Predict the failure of induced draft fans poses challenges and is time-consuming utilizing spreadsheets to gain insights.

Build a forecast model for condition-based monitoring of the induced-draft fans to plan maintenance before their vibration exceeds a critical limit.

Reduces the likelihood of unplanned outages, helping it avoid the cost of roughly $20,000 per hour.

Prediction of Power Output in natural gas fired power generation plant
Predicting power output in natural gas-fired peaker power plants is critical due to their intermittent operation and high economic significance. These plants, which supply power sporadically and at a premium price, pose a unique challenge for grid operators. We aim to forecast power output based on environmental conditions, enabling more informed decisions about plant activation and power purchasing. Exploratory Data Analysis will precede regression modeling using Apache Spark ML Pipeline to achieve this predictive capability.


- The operators of a regional power grid create predictions of power demand based on historical information and environmental factors (e.g., temperature). They then compare the predictions against available resources (e.g., coal, natural gas, nuclear, solar, wind, hydro power plants).
- The challenge for a power grid operator is how to handle a shortfall in available resources versus actual demand

- Build a Regression Model to predict power output as a function of environmental conditions.
- Build a dashboard to show real time trends

Energy prediction for boiler operations
Effective prediction of NOx and CO emissions from boilers is crucial for regulatory compliance and environmental protection. Key process parameters (KPIs) correlated with emission levels include combustion temperature, fuel composition, air-to-fuel ratio, and flue gas recirculation rates. By analyzing both historic and real-time data, it is possible to predict NOx and CO emissions accurately. This predictive capability allows for better operational adjustments, ensuring emissions remain within permissible limits while optimizing boiler performance. Advanced analytics and machine learning techniques enhance the precision of these predictions, contributing to more efficient and environmentally friendly boiler operations.


- Large variabilities in the fuel and feed water quality impacts the performance of the boiler operations
- Estimating the critical contributing factor in real time is challenging to identify

- ML based predictive model to predict the energy demand of boiler for consistent throughput
- Using advanced techniques like shap values to estimate the dynamic contributing factors for better control

- Reduction in boiler fuel consumption by ~ 6-8%
- Improvement in productivity by ~ 12-15%
- ~ 450-600k Savings annually
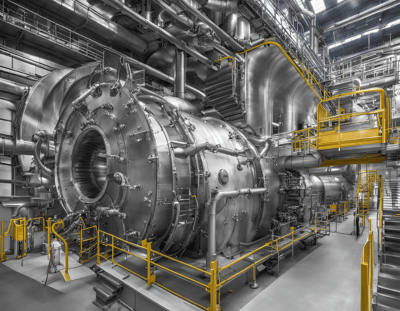
Energy yield prediction for steam turbine operations
Energy optimization of steam turbines is a critical aspect for improving efficiency, reducing operational costs, and minimizing environmental impact in industries reliant on these power-generating systems. This involves thermodynmaics based modeling of steam turbines for ensuring the efficiency is at its optimal level.


- It is challenging to ensure consistent energy production while minimizing the steam losses
- Fluctuating load and varying demand makes it difficult to make the appropriate control changes

- Dynamic load forecasting and prediction of the critical contributing factors enable to take informed decisions in real time
- Changing steam quality and its impact on the turbine performance can be predicted

- Reduction in process variability by ~ 16-20%
- Increase in steam to energy yield by 3-5%
- ~ 200-250k Savings annually
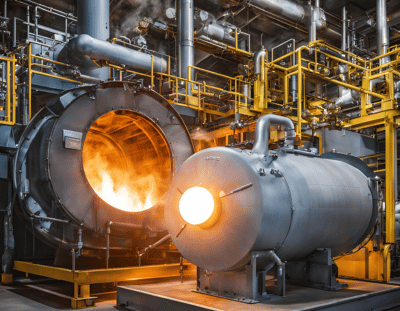
%O2 prediction in the flue gas in furnace operations
In the domain of fired heater operations, accurate monitoring and prediction of oxygen levels in flue gases play a critical role in ensuring operational efficiency and safety. This project focuses on conducting correlation and trend analysis to identify key process parameters (KPIs) that influence oxygen concentrations in flue gases. By examining factors such as fuel composition, combustion temperature, and airflow rates, this analysis aims to uncover significant correlations and trends. Leveraging these insights, predictive models can be developed to forecast the percentage of oxygen in flue gases under varying operating conditions. Such predictive capabilities enable proactive adjustments to combustion parameters, optimizing fuel efficiency and minimizing emissions. Ultimately, this approach enhances the reliability, performance, and environmental sustainability of fired heater systems.


- For efficient furnace operations complete combustion of fuel is marked as a crucial task
- Incomplete combustion can lead to degradation of mechanical components of furnace and internals deterioration

- Prediction of % Oxygen content in the flue gas stream can act as a potential indicator for monitoring the performance in real time
- ML models help the operations team with the in process corrections required to ensure consistent performance

- Improvement in furnace combustion efficiency by ~3-6%
- Reduction in coal consumption by ~ 2-4% on annual basis
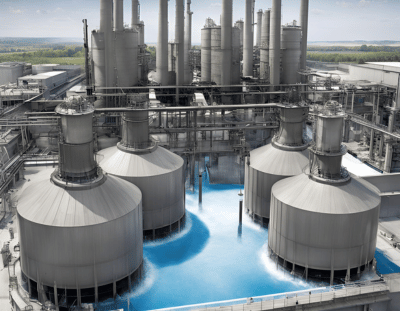
Make up water feed optimization in cooling tower operations
Optimizing make-up water usage in cooling towers through data science involves implementing a systematic approach to managing water resources efficiently while maintaining system performance. This approach is crucial for reducing water consumption, minimizing environmental impact, and lowering operational costs.


- Decisions on make-up water feed addition is challenging due to variabilities associated in feed water quality
- Optimal addition of make water is necessary to account for various losses – evaporative, draft and blowdown

- Prediction of makeup water addition as the function of water quality, and various other process parameters
- Predict the appropriate quantity of make water addition required to account for water losses without compensating on the water quality loss

- Reduction in make up water addition by 6-12%
- Improvement in cooling tower performance by 4-6%

Solar inverter anomaly detection
The development of a predictive model to classify and identify faults in wind turbines is paramount for maintaining their operational efficiency and reducing downtime. By leveraging machine learning algorithms and historical data on turbine performance, this project aims to create a robust predictive model that can accurately classify various types of faults. This proactive approach allows for timely intervention and preventive maintenance, ultimately maximizing turbine uptime and optimizing energy production.


- Maintenance and reliability of large number of inverters is difficult to estimate
- It is challenging to prioritize and plan the maintenance schedule for rating the individual inverters

- Prediction of the inverter health score as the function of ambient conditions and power generation parameters
- Detect the complex multivariate patterns which are identified as the early indicators of faults / anomalies in the inverters

- Improvement in power generation yield by ~ 4-6%
- Better visibility and track of asset fleet
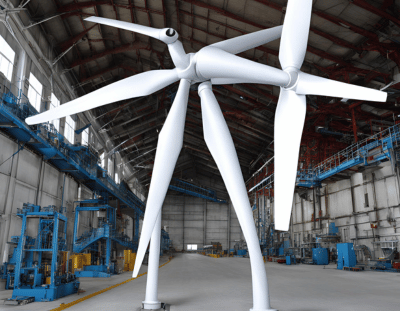
Prediction of faults in wind turbine


- Estimating radiation levels in solar cells is crucial for optimizing their performance and maximizing energy production
- Variabilities in solar radiations, weather condition and meteorological patterns makes in difficult to maintain the production at optimal level

- Implement the edge modules for collection of the all the siloed data sources
- Leverage ML models to predict the radiation patterns and identify the critical contributing factors

- Improve the reliability of energy forecast with >95% confidence
- Improvement in overall energy generation potential
Batch tracking and cycle time analysis
Reducing cycle time in batch manufacturing is challenging due to the complexity of defining and analyzing process phases to identify variations and idle times between batches. Additionally, pinpointing areas for process and capital improvements requires detailed understanding and analysis. Effective batch tracking and cycle time analysis are essential to uncover inefficiencies, minimize idle times, and make informed improvement decisions.

- It is difficult to define and analyze historical batches with traditional analytics tools.
- To identify a batch start trigger and end triggeris challenging in massive, confusing spreadsheets.

- Create a dynamic dashboard view to monitor your batches on the near-real time.
- Get the score metric of your batches that are consuming more than usual time.
- Look into the total dead time for each of the batches, and the possible reasons.

- Reduction in batch to batch variability by ~ 12-16%
- Reduction in batch rejection by ~ 2-5%
%20in%20Food%20Industry%20for%20fbcpg-1.png?width=400&height=311&name=Real-time%20Monitoring%20for%20Excess%20Giveaway%20(EGA)%20in%20Food%20Industry%20for%20fbcpg-1.png)
Real-time Monitoring for Excess Giveaway (EGA) in Food Industry
Giveaway, also known as overproduction, is a pressing concern for manufacturers in the food industry, especially those that deal with net weight items. Giveaway is the amount of extra product that makes it into each package you produce. Using live data we can develop a recommender system which suggests best values of amplitude arm and feeder arm settings based on the lowest EGA values in previous batches.
%20in%20Food%20Industry%20for%20fbcpg.png?width=400&height=311&name=Real-time%20Monitoring%20for%20Excess%20Giveaway%20(EGA)%20in%20Food%20Industry%20for%20fbcpg.png)

- Product giveaway, or overproduction, presents a substantial challenge for manufacturers dealing with net weight items.
- It refers to the excess amount of product that makes it into each package beyond the specified weight

- To develop a live dashboard to continuously monitor the trend of acceptable dump weight, acceptable pack count signal and control extra give away of material.
- Develop a recommender system which suggests best values of amplitude arm and feeder arm settings based on the lowest EGA values in previous batches.

- Real time process corrections enables reduction of batches by 1-3%

Overall Equipment Effectiveness Calculation
Overall Equipment Effectiveness (OEE) reporting is essential for identifying process bottlenecks and maximizing production efficiency across a manufacturing site. By providing a comprehensive understanding of equipment performance, OEE reporting helps streamline operations and improve productivity. However, standardizing and scaling OEE analysis across diverse assets ensures consistent performance measurement and facilitates effective decision-making for operational improvements.


- The inconsistency of the data and calculation can result in the incorrect focus on problems that do address the operational issues
- Due to the manual nature of the data collection, there can be a significant lag between events and reports

- Dynamic dashboards were developed and published in Power BI dashboards for real-time shop-floor monitoring
- Real-time calculations of OEE, OA bring more visibility to the operations team, in order to prioritize their troubleshooting activities and bring about the focus to the actual problem.

- Improvement in OEE by 6-8%
- Quality improvement by 1-2%

Order Fill Projection
Data analytics for order fill projection using live data in the food and beverage industry involves analyzing current and historical data to predict the ability to meet customer orders effectively and efficiently. This process is vital for optimizing inventory management, reducing waste, and improving customer satisfaction.


- In a sizable manufacturing facility with frequent shipments to oversee, gauging whether ongoing production aligns with the anticipated totals for their designated delivery dates poses a challenge.
- Adhering to these deadlines is paramount for streamlining logistics efficiency and maximizing both revenue and the shelf life of products.

- Totalize fill rate to determine total number of cups filled in the current order
- A predictive model was build to predict when current order will be completed bsed on days in order

- Early indication for process corrections
- Significant savings in operation time and money with a reliable order fill projection system
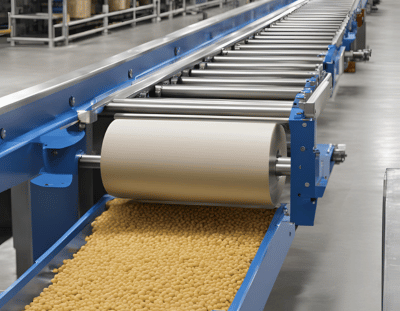
Predict Conveyer Belt Tensioning Date
Predictive maintenance of conveyor belts in the food and beverage industry focuses on preempting breakdowns and optimizing conveyor operation through data-driven insights. This proactive maintenance strategy is essential to minimize downtime, ensure consistent product quality, and maintain high hygiene standards.


As time progresses, the tension on a conveyor belt diminishes, leading to shifts in tracking from side to side. Shortly after experiencing poor tracking, the belt eventually fails. In a system comprising 100 belts, it is customary to encounter at least one belt failure per day.

- The implementation of the predictive model is used to transition to condition-based maintenance.
- By gaining insight into the future condition of the belts, operators can proactively redirect product away from conveyor belts at risk of imminent failure to alternative flow lines.

- Upto $50k annually savings by recouping lost-opportunity cost
- Improvement in maintenance strategy through predictive capabilities
TTV A-33 Program
Time to Value program leverages advanced scalability frameworks to deliver superior analytics solutions to manufacturing industries. Designed for rapid implementation, our program ensures larger delivery with unparalleled speed and efficiency. By utilizing scalability frameworks, we significantly reduce the time and cost associated for standard approaches. and accelerates deployment, allowing manufacturers to quickly gain insights and drive improvements in their operations. With our program, clients benefit from faster, data-driven decision-making, enhanced productivity, and a swift return on investment, making it the optimal choice for modern manufacturing analytics projects.
.png)
Our Time to Value program ensures 33% more delivery by harnessing the power of model transfer learning techniques and standardizing critical parts of the project lifecycle. By building smart applications tailored for our customers, we simplify deployment and enable faster realization of benefits. This approach allows us to deliver more projects and use cases within the same timeframe.
With our smart standardization and approach of employing a advanced scalability and automation techniques we built smart apps that facilitate quick integration and easy deployment, accelerating the overall project timeline. This method assures that industries receive rapid and impactful analytics insights, enhancing their operational efficiency and competitiveness.
TTV A33 execution methodology is crisply defined to minimize redundant efforts and maximize the reuse of existing models, significantly cutting down development time and expenses. Further smart applications streamline deployment and reduce the need for extensive custom development, further lowering costs to offer high-quality analytics solutions while driving significant savings for our clients.
Schedule a Call today!
Uncover how our capabilities can propel your organization forward. Provide your focus areas, and we will deliver tailored solutions designed to meet your unique objectives.
